Section 4 ABC analysis (Pareto chart)

ABC analysis (reference) screen


The ABC distribution is sometimes expressed as the price of each item. This may be a valuable tally for purchasing or sales departments, but in system design, it is only a reference and is not sufficient as a basis for deciding on a system.
The table on the left shows the ABC analysis for reference.

The table is a sorted ranking table of item counts to display a Pareto chart.

Case shipments and individual shipments are counted separately.


Section 2 Conventional calculation

 Chapter 7 Tera calculation reference
ABC analysis is called ABC because it divides shipping data into three parts, from high to low flow, but from practical experience, I felt that it would be easier to consider logistics equipment if there were more divisions.
Tera calculation uses the same concept as ABC analysis, dividing the divisions into five blocks. Tera calculation calls this aggregation method conventional calculation.

Section 1: Overall data compilation

Conventional calculation screen


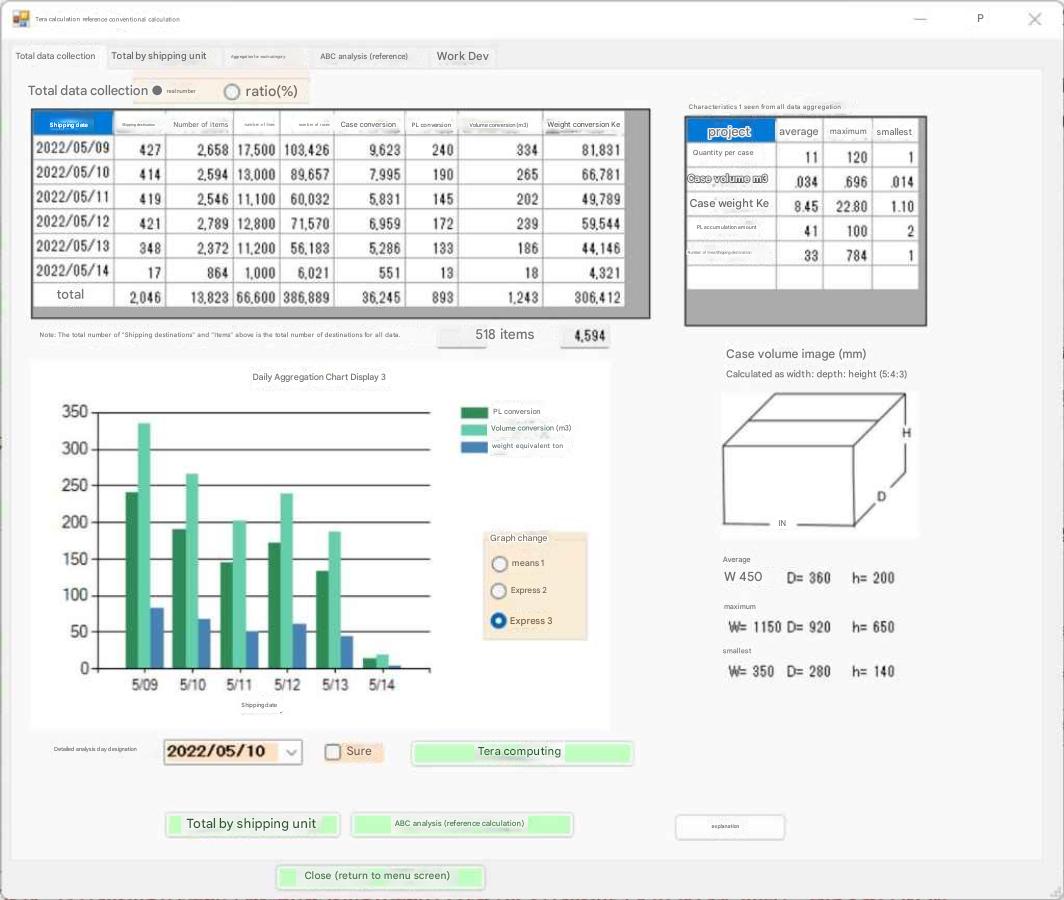
出荷データにはケース容積データはあるがケース寸法の概念がない。
「ケース容積イメージ」は縦5、横4、高さ3の比率でケース寸法をイメージしている。
ケース容積を算出しているということは、別データとしてケース寸法データは有るので、ケース寸法データと出荷データをリンクすればアイテム個々の寸法を解る。Tera計算ではケース寸法データが手元に無いとしてケース寸法を推定している。

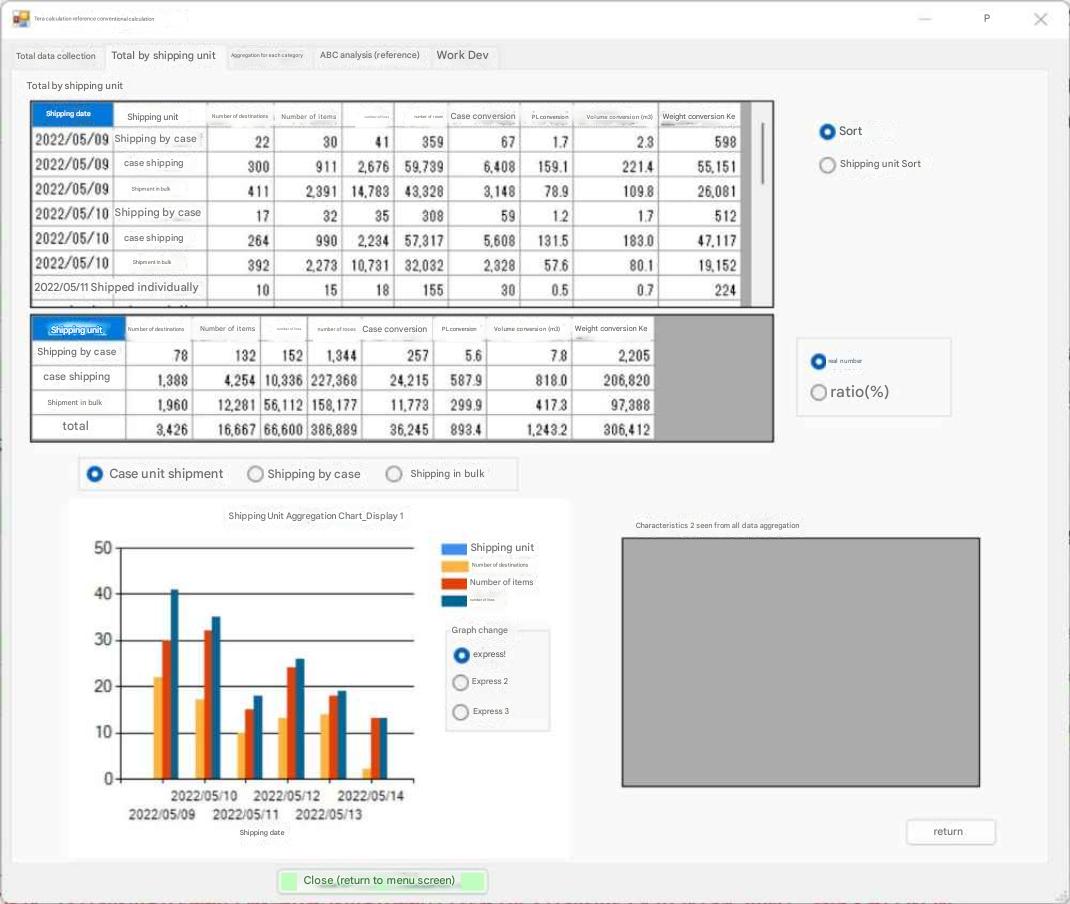
ケース出荷とバラ出荷は保管方法や作業方法が異なる。
上記、全データ集計画面では、ケース出荷とバラ出荷の区分がされていないので、機器の割り付けは出来ない。システム設計としては参考データである。
The "Shipping Data Summary" table on the left is a compilation of all shipping data by item, but also includes additional items not included in the shipping data, such as case, PL, volume, and weight conversions. The

"% Percentage" radio button indicates the percentage of each shipping date when all shipping data is 100%.

The total destinations and items in this shipping data are cumulative values ​​for duplicate shipments on each day.
The shipping data includes 518 destinations and 4,594 items (as shown).

The "Graph" shows the shipping date, 2022/05/10 .
Display 1 shows destinations and items,
Display 2 shows the number of loose items ,
and Display 3 shows PL, volume, and weight conversions.

The "Characteristics as seen from the total data compilation"
shows a wide variety of case quantities, ranging from 1 to 120.


Section 3: Rank-based tally

Conventional calculation (ABC analysis application)


The above table allows for classification into case shipments and bulk shipments, and also allows for ranking, making it easy to allocate equipment.

Storage equipment allocation uses the average of all data (see Chapter 3, Tera Calculation 1 - Shipping Data Analysis, and Section 2, Allocating Equipment) and item aggregation. Dividing

into five blocks allows for flexibility in allocation, such as combining CPLI_A1 and CPLI_A2 to create an electric shelving unit, or using CPLI_A2 and CPLI_B as fixed shelving units.
The table on the left is the table displayed in "Tera Calculation 1_Shipment Data Analysis."

This table extracts and aggregates case shipments, and similar aggregation is possible for bulk shipments.

The ABC analysis is aggregated by dividing into 5 parts instead of 3. You can

check how many items of each rank have been shipped, including not only the bulk quantity but also the converted value.

This aggregation uses the same divisions as the EIQ matrix table, so the aggregation results will be the same as the EIQ matrix table.


Section 2: Aggregation by shipping unit

Summary screen by shipping unit


In the explanation of total data collection, it was written that "case shipments and bulk shipments have different storage and work methods," but "case shipments and bulk shipments have different storage and work methods even though they are quantity shipments."

Equipment cannot be allocated when collecting case shipments and bulk shipments separately. This data is for reference in system design.
The table can be viewed in the same way as the previous calculation screen. The figures

are tallied separately for case shipments and bulk shipments.

Normally, case shipment records (rows of shipping data) ship in case units. The same applies to bulk shipments.

Occasionally, there will be a shipment with one case in one record, with an additional case counting three bulk shipments; case bulk shipments refer to these shipments.

This case bulk shipment is counted as one record with two shipments, one case shipment, and one bulk shipment, and is incorporated into case shipments and bulk shipments when calculating rank.

Note:
After rank calculation, the figures for case bulk shipments will not appear.