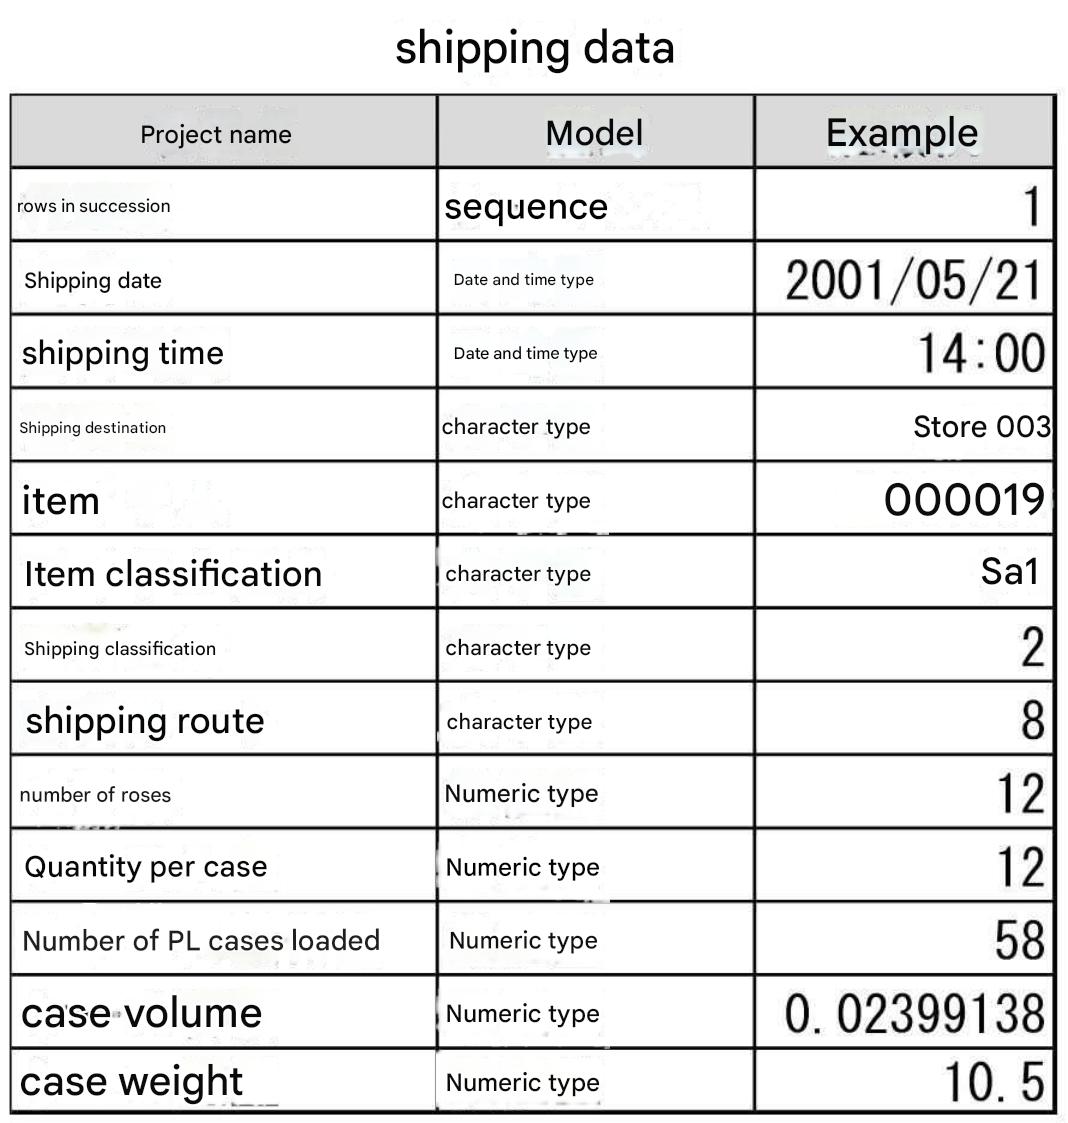
Section 2 Shipping Data Processing
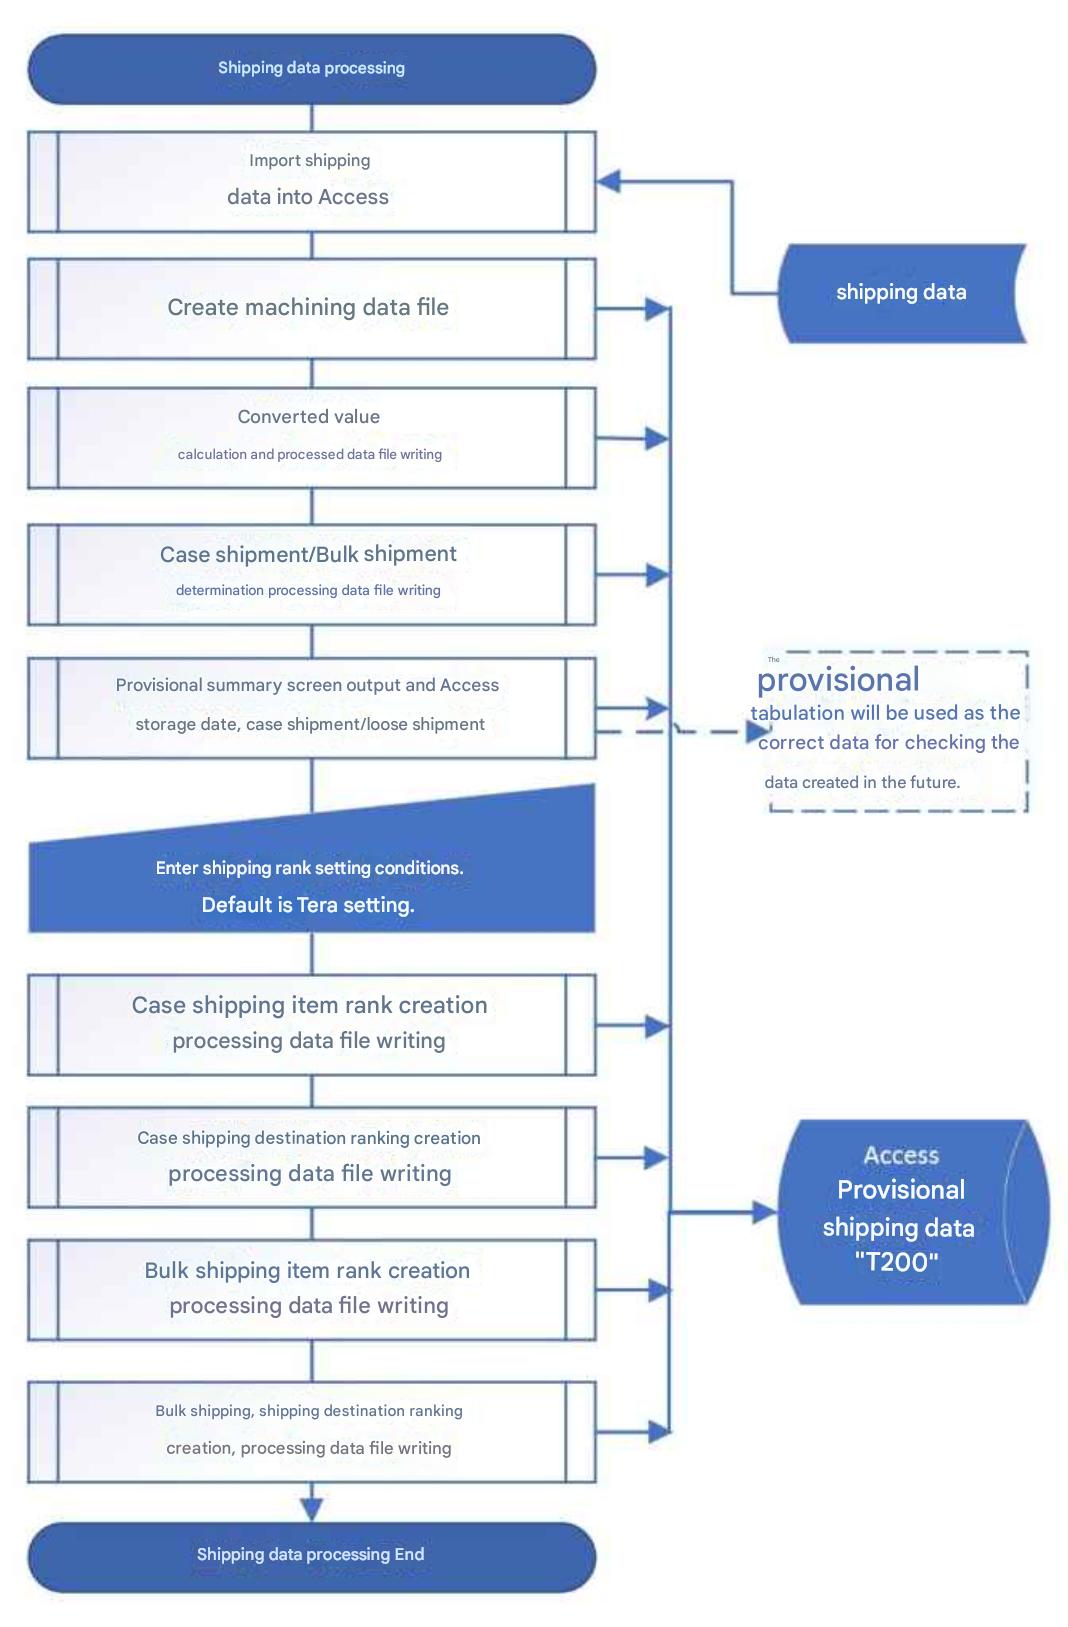
It is not possible to design a logistics system by aggregating only the items in the shipping data. Tera Calculation 0 distinguishes between case shipments and bulk shipments, calculates the conversion of bulk shipments, and ranks shipping destinations and items. |
|
||||||||||
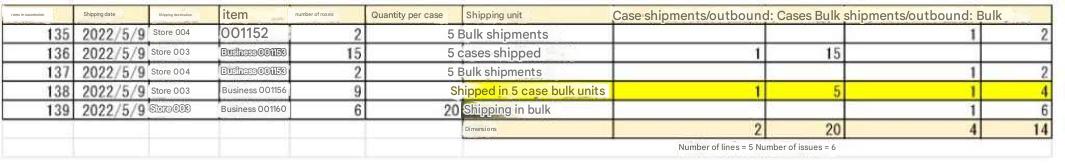
Item 3: Distinguishing between case shipments and bulk shipments |
||
 |
||
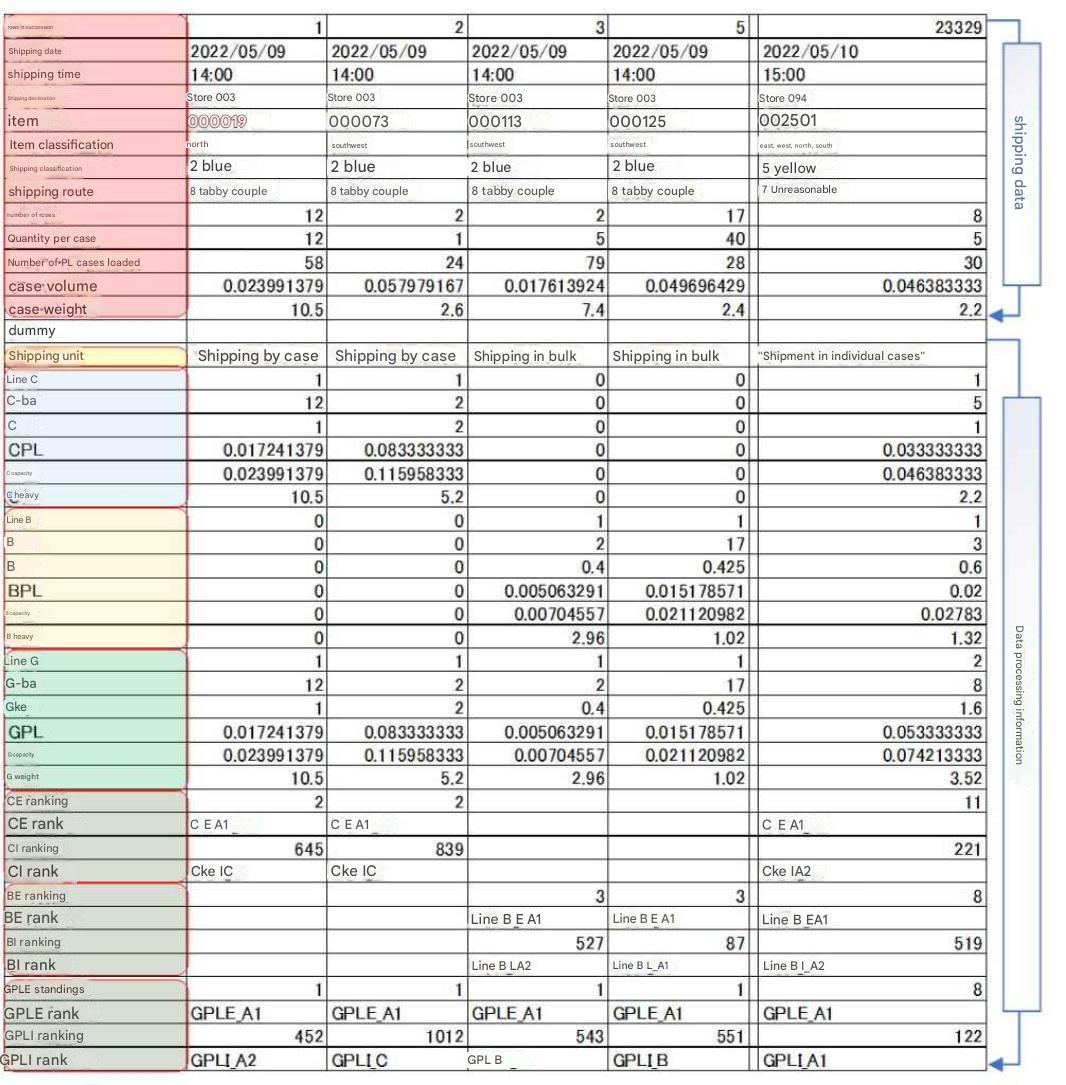
| Distribution centers handle cargo in PL, case, and bulk shipments. Tera calculations analyze and aggregate case shipments separately from bulk shipments because the work and storage methods at distribution centers differ between case and bulk shipments. The calculation is as follows : 1. If the quantity is less than one case, it is bulk shipment (case conversion < 1). 2. If the quantity is one case or more and there is no decimal point, such as 1. or 5, it is case shipment (case conversion > = 1 and bulk quantity modulo case quantity = 0). 3. If the quantity is one case or more and there is a decimal point, such as 1.1. or 5.3, it is case bulk shipment (case conversion > 1 and bulk quantity modulo case quantity < > 0) . 4. In the case of 3., the integer portion is treated as case shipment, and the decimal portion as bulk shipment. Number of cases in a case shipment = Int (bulk quantity / case quantity). Number of bulk shipments in a bulk shipment = bulk quantity - (case conversion * case quantity). Calculation example : When shipping 9 bulk shipments of product B, which has a 5-case quantity, to destination A, 1 case and 4 bulk shipments are shipped. At this time, the work at the distribution center is as follows: 1 case is shipped in bulk from the inventory area mixed with the same items for other shipping destinations and sorted in the sorting area, 4 loose items are picked and shipped from the flow shelves or medium-weight shelves in the shipping work area. The distinction between case shipments and loose shipments is calculated on a record-by-record basis. PL unit calculations can be calculated as needed from the conversion value. Note: In small-scale centers, 2 case shipments and 3 loose shipments may be shipped directly from the inventory area at once, but Tera calculations are calculated assuming a distribution center where case-based shipments and loose-based shipments are separated. These calculation results are saved in the "T110_Classification Conversion" table.  In the above table, "Row C" means the number of case shipments, "Row B" means the number of loose shipments, and "Row G" means the number of cases + loose shipments. The first digit C, B, and G represent the shipping classification, the second digit Row = number of rows, Ba = number of loose items, Ke = case conversion, PL = pallet conversion, Volume = volume conversion, and Weight = weight conversion. |
||
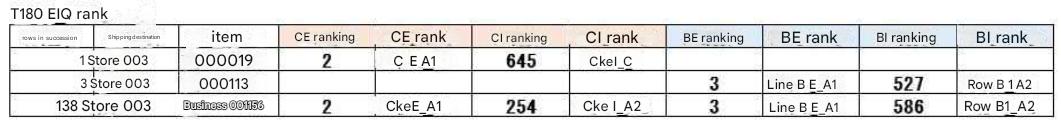
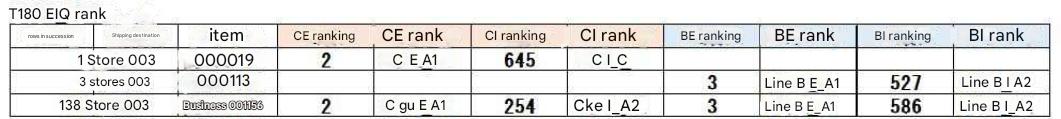
Item 4: Rank |
||
Ranking items
|
||
Ranking shipping destinations
 |
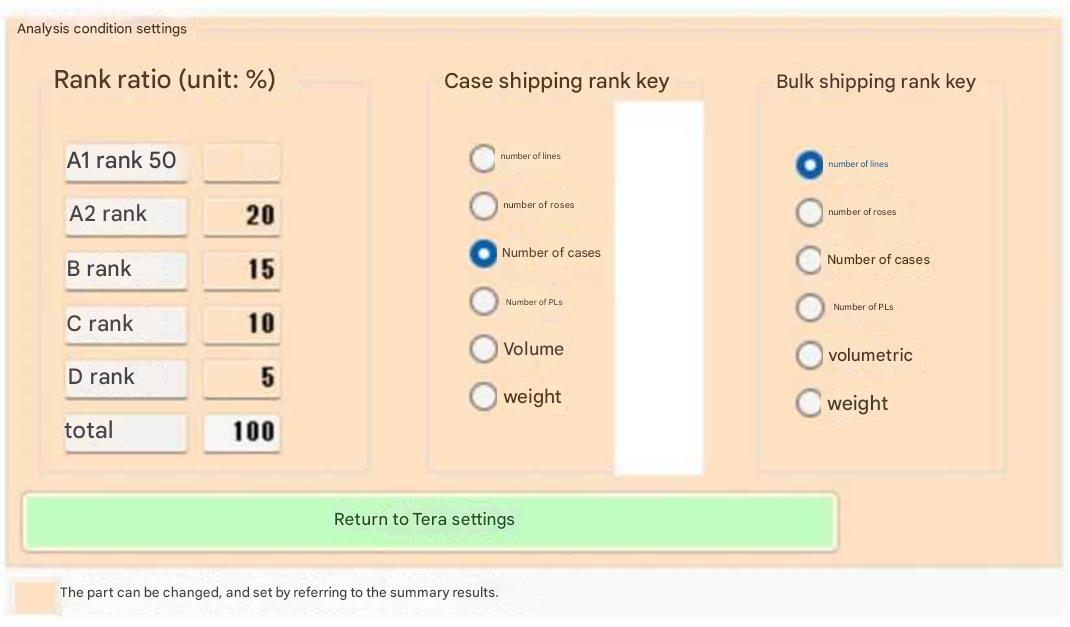
The method for ranking destinations is the same as for item rankings, with five categories.
The same ratio settings (Tera settings) are used for ranking destinations as for item rankings.
The ratios and rank keys used for ranking can be set.
Create the "T200" table by linking "T180" and "T110" to "Shipping Data".
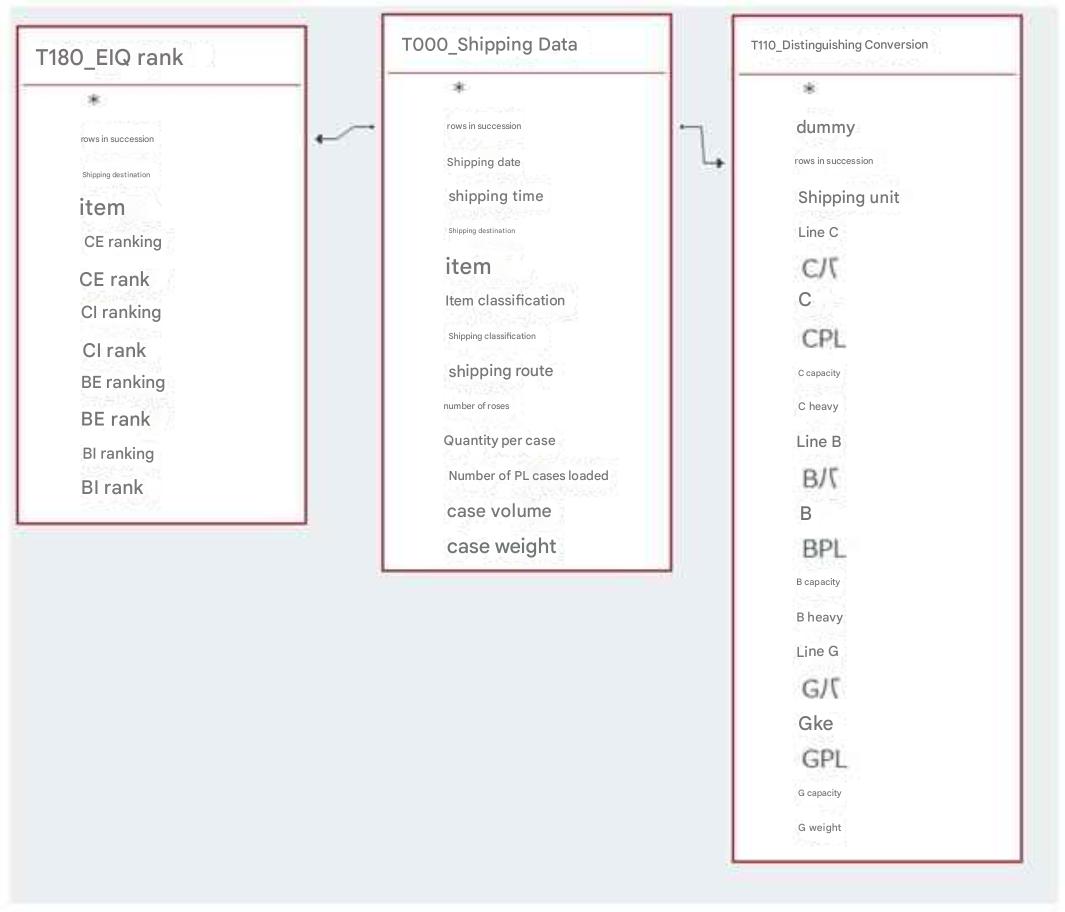 |
After creating " T110_Division Conversion" and " T180_EIQ Rank" as described above, link these two tables with " T000_Shipping Data" to create a new " T200 " table. The reason for not using the link on the left is that using the "T200" table simplifies SQL statement creation and improves processing speed due to software reasons. Tera Calculation 1 and 2 only access the "T200" table to perform analysis and aggregation, while Tera Calculation 0 does not create the " T200 " table. Linking " T110_Division Conversion" and " T180_EIQ Rank" with "Shipping Data" has the advantage of reducing access capacity, however... |
Item 5: Table File Layout |
|||
|
|||
Ranking Key |
|||
| The ranking key is the numerical value used as the basis for ranking
(ranking is achieved by aggregating the rank key). If the rank key is bulk quantities, the ranking is based on the bulk quantities. If the rank key is case quantities, the ranking is based on case conversions. Tera Calculation 1 targets peak shipping dates. The ranking key for bulk shipments is the number of rows, and for case shipments, the ranking key is the case conversion. This is used to calculate the shipping capacity of the inventory-to-shipping work area. Tera Calculation 2 targets the average of all shipping data, and the ranking key for both bulk and case shipments is the product liability (PL) conversion. Distribution center size calculations are primarily performed from receiving to inventory, which often involves calculating storage volume, such as product liability and volume. While there is much debate about what ranking key to use, the author believes any choice is acceptable. Observations By changing the ratio and rack division key in Tera Calculation 2_Distribution Center Size Calculation, you can check the change in distribution center area. (Calculation results are displayed in 1-2 minutes.) The ranking is separated into case shipments and bulk shipments, because case shipments and bulk shipments have different operational procedures. If case shipments and bulk shipments are not distinguished, bulk shipments will rank higher when aggregated based on the number of shipments, while case shipments will rank higher when aggregated based on case equivalents, resulting in a contradiction. Tera Calculation ranks bulk shipments and case shipments according to their respective circumstances, and selects a method for analyzing and aggregating bulk shipments and case shipments separately. However, when calculating inventory, we determined that averaging all shipping data (bulk shipments + case shipments) is more reasonable. ABC analysis divides logistics volume into three ranks, from high to low flow: A rank 70%, B rank 20%, and C rank 10%, but we feel that three ranks are not enough distinctions. Based on experience, a five-rank division allows for a fair division of equipment allocation and operational classifications. |