Section 1 Contents of shipping data |
| Chapter 3 Tera Calculation 1 - Shipping Data Analysis |
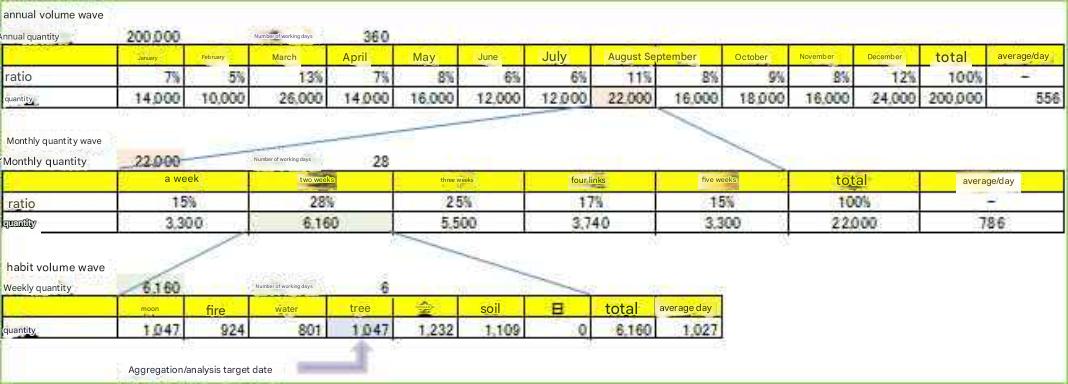
| Distribution centers ship products based on destination orders, and this summary of shipping records is called shipping data. "10 units of product B shipped to destination A" is a record of E (Entry), I (Item), Q (Quantity). Tera calculations cannot design a distribution center with just the above EIQ information, so necessary items have been added. The data below are shipping data items. |
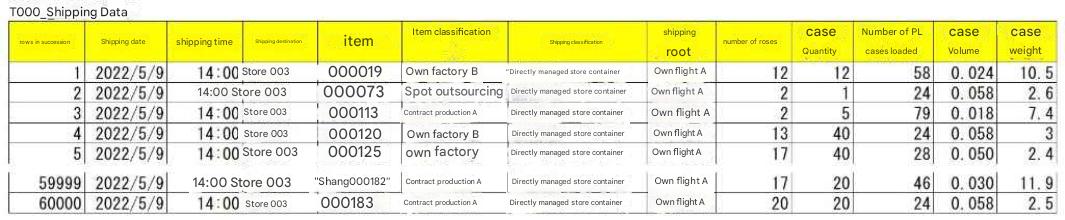 |
Row Sequence Number: The order of the shipping data records (the sequential number assigned to each record).
Shipping Date: The date of shipment (shipping data may contain multiple shipping dates).
Shipping Time: The time of shipment; used to calculate the quantity per hour.
Shipping Destination (E): The name of the company or store where the product was delivered.
Item (I): The product name or product code (SKU classification is possible).
Item Classification: This field is used to extract or exclude item ranges when analyzing and compiling shipping data. If not required, enter "Not specified."
Shipping Category: This field is used to extract or exclude destination ranges when analyzing and compiling shipping data. If not required, enter "Not specified."
Shipping Route: The name of the shipping route for a group of destinations that can be loaded onto the same truck, or the name of the shipping route for managing multiple groups of destinations.
Quantity (Q): The smallest unit (SKU) for work and management.
Case Quantity: This field is used to calculate the case conversion, distinguish between case shipments and bulk shipments, and calculate the quantity.
PL Case Stack Count: This field is used to calculate the pallet conversion (hereafter referred to as PL conversion), and indicates the number of cases that can be stacked on a specified pallet.
Case Volume: This field converts bulk shipments to volume (calculated after case conversion). "Case Weight" and "Case Weight" fields convert bulk shipments to weight (calculated after case conversion).
Shipping data used for Tera calculations (see attached Excel) cannot have its column or field names changed.
Please understand this is a rule when importing shipping data into Tera calculations.
出荷データ 単純集計
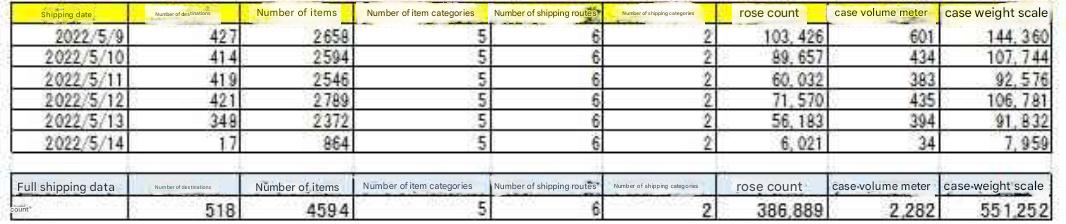 |
Shipping data is 60,000 records. The size of the distribution center is ranked from the upper mid-size to the lower large size. The industry is assumed to be a distribution center mainly for B2B small home appliances and electronic devices. |